
How to Use Support and Resistance
Two of the most common terms you’ll hear when analysts talk about crypto prices are "support" and "resistance." Here’s what they mean and how they can inform trades.
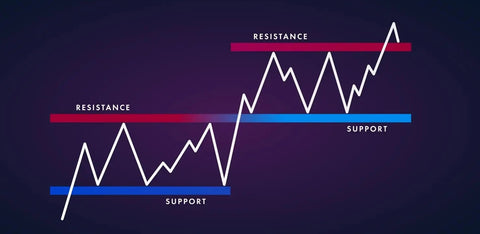
How to interpret support and resistance levels when trading
Support and resistance levels are useful to traders who want indications about the near future of a cryptocurrency’s price. A trader who buys a cryptocurrency ahead of a coin breaking through a predicted “resistance” level could sell for a profit shortly after the coin reaches said level, if the coin has, as predicted, risen in price. The converse is true for those who want signals about when to exit the market before a coin becomes oversaturated.
Technical analysts defer to different methodologies when constructing support or resistance lines on popular analytics platforms, like Trading View. The simplest tool is to draw a horizontal line on a coin's charted movements to look at the peaks and troughs, deducing from these events the prices at which traders are likely to buy the cryptocurrency and pump the price, or sell the cryptocurrency and sink the price.
Others use simple moving average trend lines to spot support and resistance levels, using, for instance, 200-day and 50-day moving average lines to identify points of support and resistance:
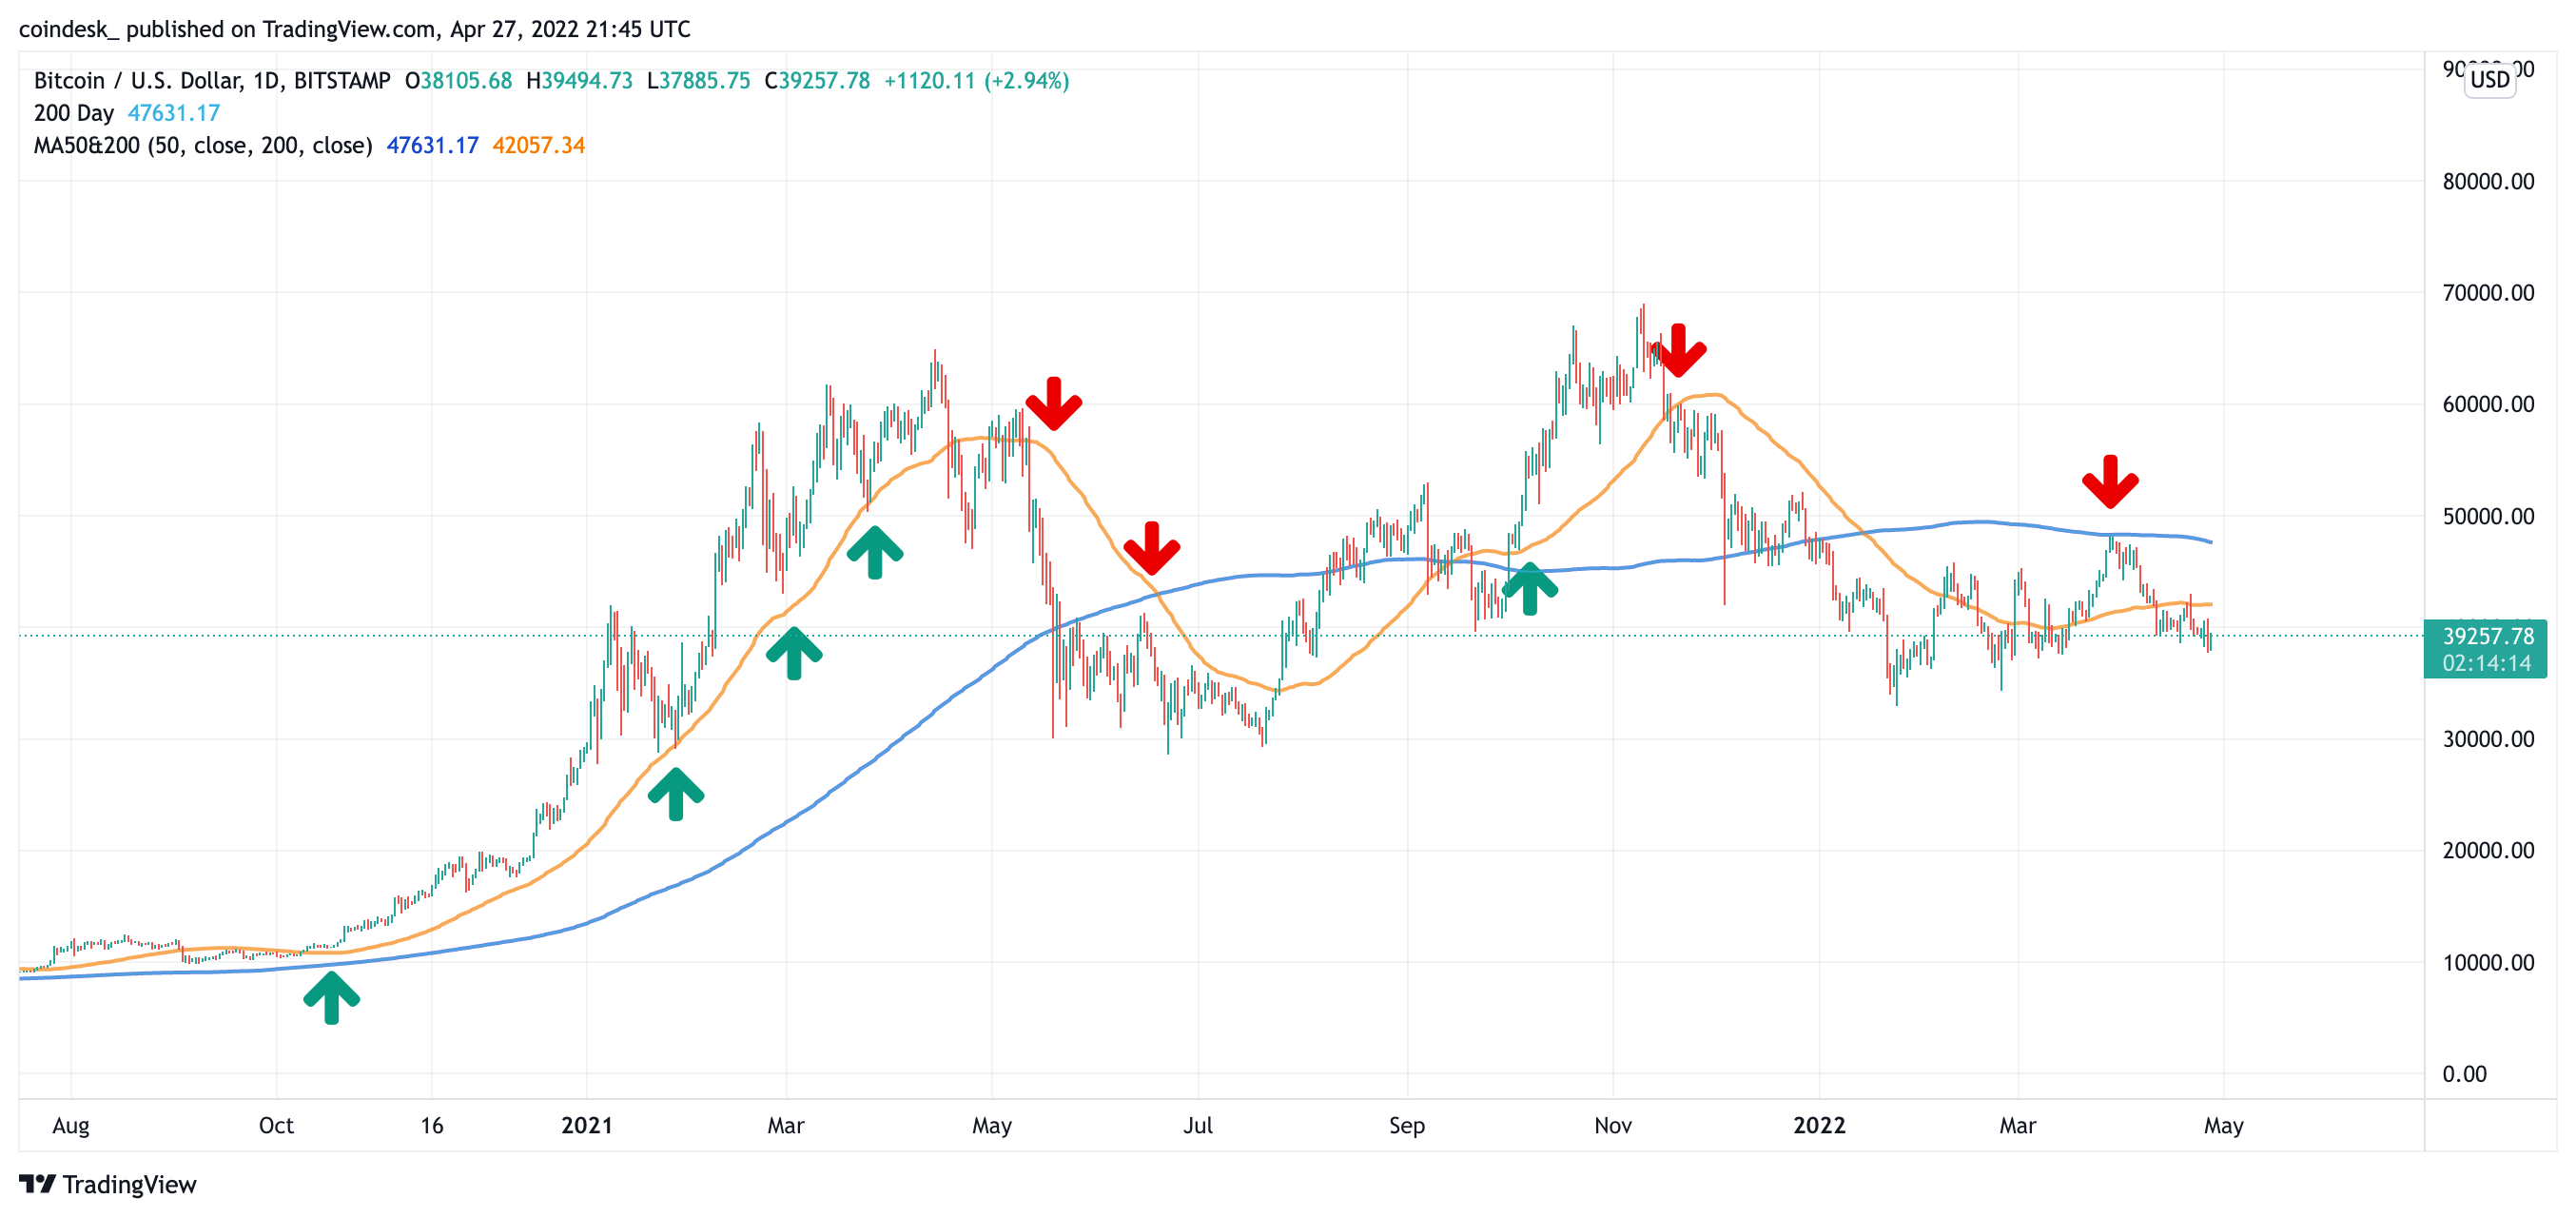
Bitcoin’s 50-day (blue) and 200-day (orange) moving averages serve as support and resistance for the price. (TradingView)
Sometimes analysts rely on no firm mathematical methodology at all, instead drawing lines as they please that support their arguments. Because the support is psychological, the market and its analysts tend to put these lines at round numbers like $20,000 or $2,000 or $200. Consider the screenshot below, a price chart of bitcoin onto which an automated script has superimposed support lines:
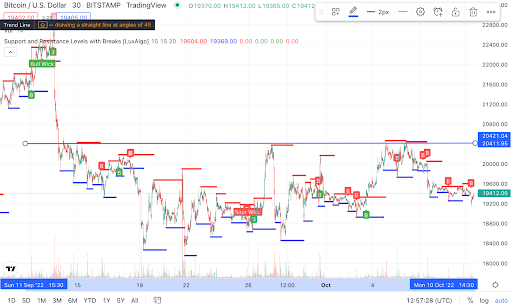
Support and resistance lines (TradingView)
The advice, according to the technical analysts, is to buy an asset when it bounces off the support level and get out of the trade after the resistance level fails to break.
Other tools to identify support and resistance
Horizontal lines are just one analytic tool in the kit of a technical analyst, as well as using moving averages, which we discussed above.
Another advanced metric used to identify support and resistance is the Fibonacci retracement line.
This identifies potential future ranges from Fibonacci numbers – a sequence of numbers where each entry is 1.618 larger than the preceding number. Cryptocurrency traders use Fibonacci retracement lines because they provide the highest and lowest possible prices in a certain period of time, then dividing the distance on the chart by these Fibonacci ratios to provide glimpses into the future.
Analysts also use Bollinger Bands, another method that provides three trend lines: average prices over a given time period, plus upper and lower trends for that period.
It should be noted that none of these tools provide conclusive insights into the future prices of cryptocurrencies. Instead, they are used to predict prices and should be taken with a pinch of salt. Sometimes history repeats itself, but not always.
Credit: coindesk.com